Dashboard
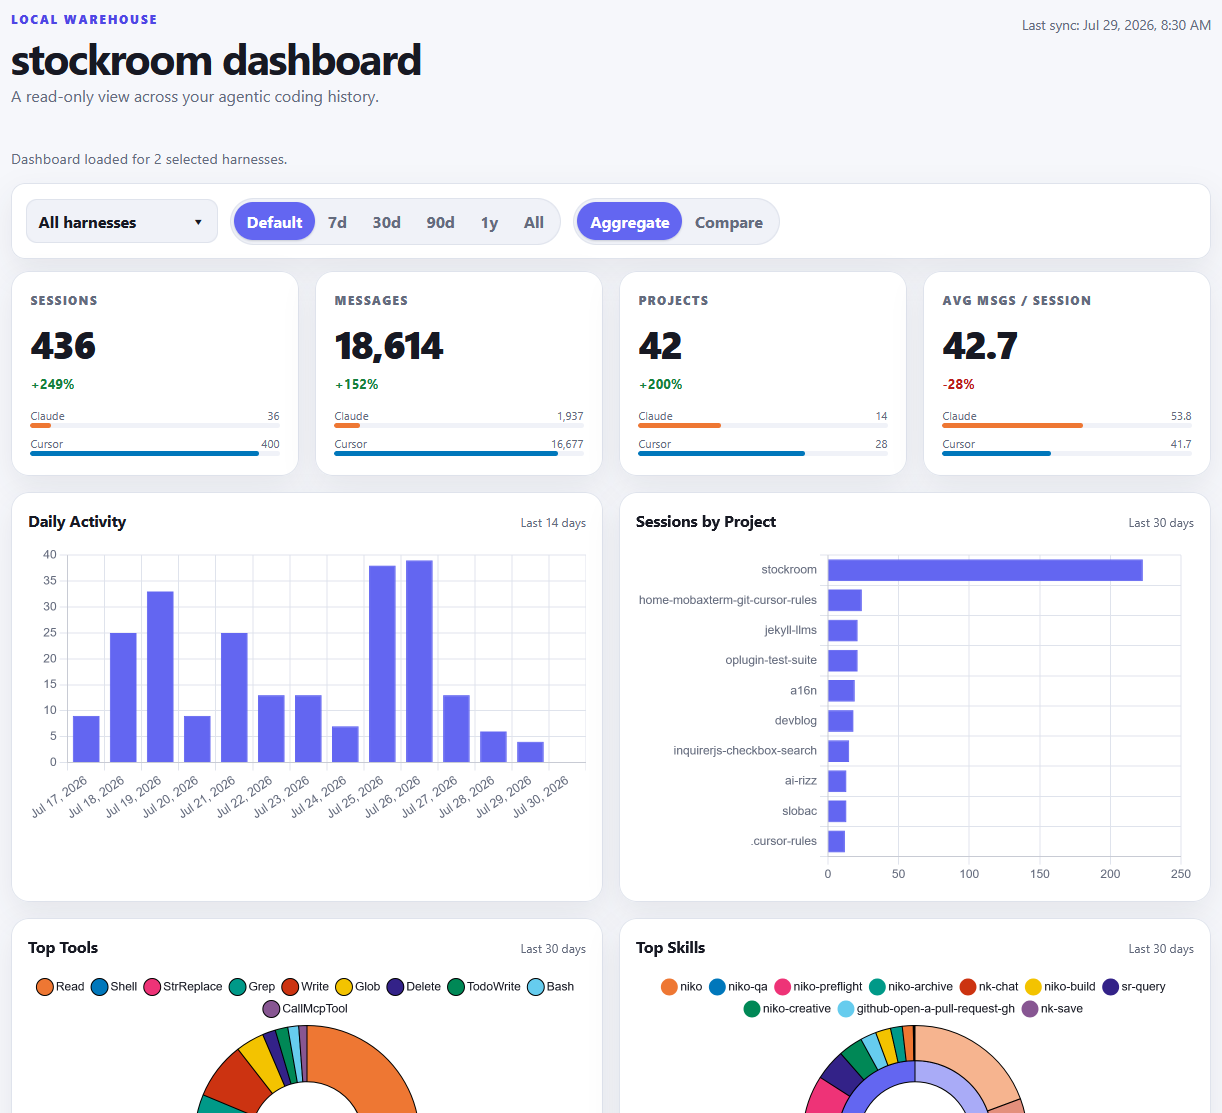
The stockroom dashboard is a local, read-only, fully offline metrics UI over your warehouse — an at-a-glance view of cross-harness agentic-coding history. It does not ingest, embed, or migrate; freshness is owned by Load the Warehouse.
The long-lived dashboard process caches successful API JSON responses in memory until warehouse.duckdb changes on disk (ingest, backfill, or any other writer). A browser refresh against an unchanged warehouse reuses that cache instead of reopening and re-querying DuckDB.
Default URL: http://localhost:58008 (also http://127.0.0.1:58008/). Every front-end asset is vendored — no CDN or external web requests are made at runtime. You can use it w/out an internet connection!
sr-dashboard
The skill launches (or re-prints) the dashboard URL. Use it when you want the UI, not a SQL or semantic answer.
| Harness | Slash form |
|---|---|
| Cursor | /sr-dashboard |
| Claude Code | /stockroom:sr-dashboard |
The server is idempotent: if something is already listening on the port, the command still prints the URL and exits cleanly.
Session-start hooks also attempt to launch the dashboard automatically when plugin hooks are registered.
What you see
Metrics
Harness filters, time ranges, and Aggregate / Compare views over sessions, messages, projects, daily activity, tool distribution, and related rollups. The warehouse is machine-scoped: the UI stays up across harness sessions and is not stopped when one IDE closes.
The date range runs Default · 7d · 30d · 90d · 1y · All. Default is not the widest setting — it lets each panel keep its own natural window (30 days for most, 14 days and 12 weeks for the activity trends). All starts at your earliest recorded activity rather than at some fixed epoch, so the axis covers your history and nothing more; the KPI cards read New under it, since there is no preceding period to compare against.
Sessions
The metrics Sessions panel shows up to 20 matching conversations (10 newest + … N more + 10 oldest when there are more). Click a row to open reconstruction, or … N more for the paginated sessions-list view. That list has its own harnesses, time range, and per-page control; filter state lives in the URL.
Both the panel table and the full list include a Tokens display. Counts use a compact Kilo / Mega, etc-style total; hover the ? for an input / output / cache breakdown when usage is known
List deep-link examples:
http://127.0.0.1:58008/?view=sessions&harness=cursor&per_page=50
http://127.0.0.1:58008/?view=sessions&harness=cursor&harness=claude&per_page=100
http://127.0.0.1:58008/?view=sessions&harness=claude&since=2026-07-01T00:00:00Z&until=2026-08-01T00:00:00Z&page=2&per_page=25
http://127.0.0.1:58008/?view=sessions&per_page=all
Session inspection
Open a conversation from Sessions (or a deep link) to see session metrics and tool/skill composition charts, then read through the whole conversation. Copy a deep-link or export markdown/JSON when in-dashboard rendering is not enough.
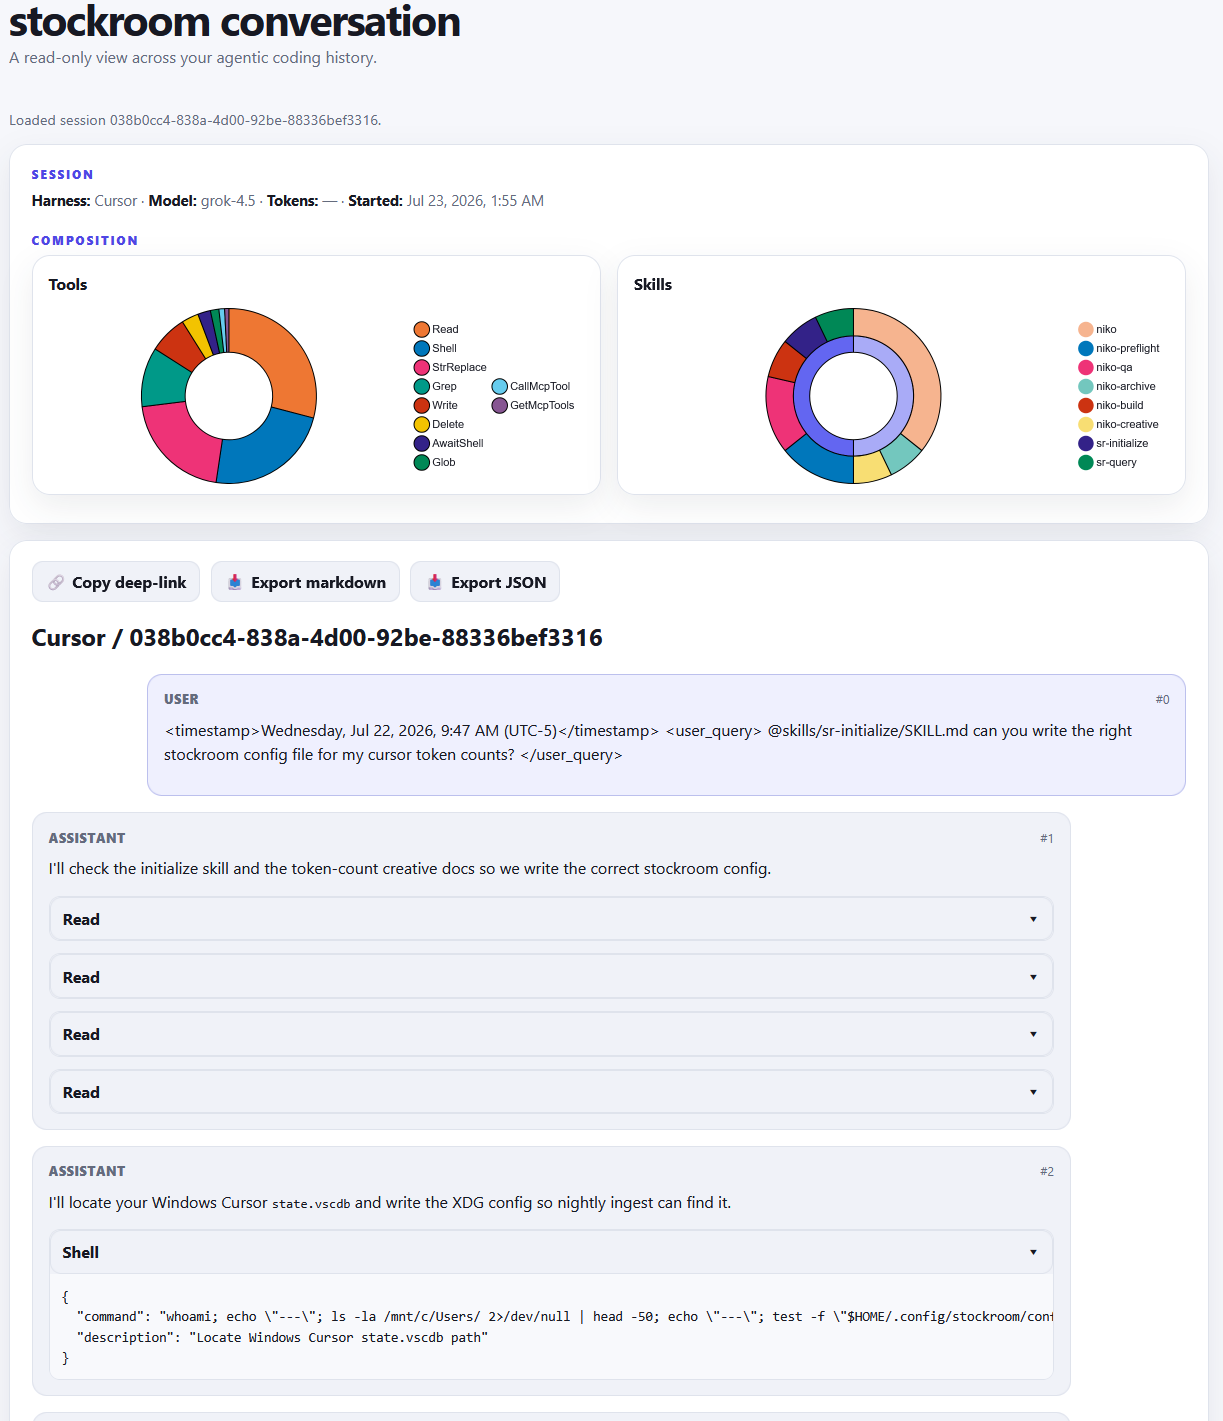
Session deep-link shape (both query params required):
Appending an optional message hash scrolls to that message after the conversation loads. A spawn hash scrolls to the subagent pill under that turn:
http://127.0.0.1:58008/?view=session&harness={harness}&session={session_id}#msg-{ordinal}
http://127.0.0.1:58008/?view=session&harness={harness}&session={session_id}#msg-{ordinal}-sa-{n}
Lifecycle notes
- After a plugin update moves the engine path, harness hooks are what rebake the on-path shim (they know the plugin root). Cursor also runs a non-blocking path-only
shim rectifyon each prompt submit as suspenders whensessionStartmisses (common on some macOS Cursor setups); full ensure + dashboard launch still belong to session start. - If a document request cannot be served as real UI, the listener may return a short recovery HTML page (instead of bare JSON) with a few starting steps and a link into troubleshooting. Many causes are possible — Dashboard UI will not load.
- Port conflicts and auto-start misses: Troubleshooting > Dashboard.
For search (not browsing), see Search. For every skill at a glance, see Skill index.